搭建Grafana数据大屏
在阅读本小节前,请确保你已经基于 搭建InfluxDB2.0数据库 小节正确安装了InfluxDB数据库。
Grafana简介
Grafana 是一个开源的数据可视化和监控工具,广泛用于数据分析和系统监控。它可以通过连接多个数据源(如 Prometheus、InfluxDB、Elasticsearch 等)实时展示数据,并允许用户创建交互式的仪表板。
使用Docker-compose安装Grafana
创建docker-compose.yml
在用户家目录下,新建grafana文件夹,用于存放yml文件以及grafana数据,同时,修改该文件夹的权限,避免容器启动后由于权限不足无法创建其他目录。
cd
mkdir grafana
chmod -R 777 grafana
cd grafana
在grafana文件夹下,使用vim 新建一个docker-compose.yml文件
vim docker-compose.yml粘贴以下内容
services:
  grafana:
    image: hub.rat.dev/grafana/grafana:12.2.0
    container_name: grafana
    restart: always
    ports:
     - '3000:3000'
    network_mode: "bridge"
    volumes:
    - "./:/var/lib/grafana"
运行容器
使用命令运行容器,它会自动下载镜像并创建容器
sudo docker compose up -d
配置Grafana
登录管理后台
使用浏览器,打开链接 http://localhost:3000
默认用户名admin,密码admin,你可以在登录后修改密码。

创建数据源
点击左侧的 Connections -- Data Sources -- Add data source

在接下来的页面,从Time series databases(时序数据库)分类中选择InfluxDB
注意
如果你之前已经参考 该小节 创建了InfluxDB容器,请使用命令sudo docker start influxdb启动它。
回到WSL 终端,使用命令sudo docker network inspect bridge 查询一下influxdb在docker bridge网络下的IP,如下图所示,我这里查到的是172.17.0.3,你的可能跟我的不一样。

回到Grafana管理后台,配置查询语言 Query Language 为 Flux,设置InfluxDB的URL为http://172.17.0.3:8086(IP地址以你通过命令查询到的为准)

页面往下拉,在 InfluxDB Details 部分,填写下述2个内容:
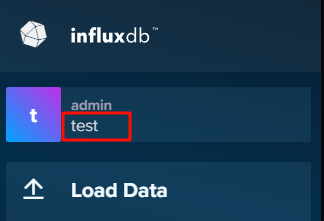
(1)Organization填写为 test,该名称可以在InfluxDB后台侧边栏查看到,如下图所示
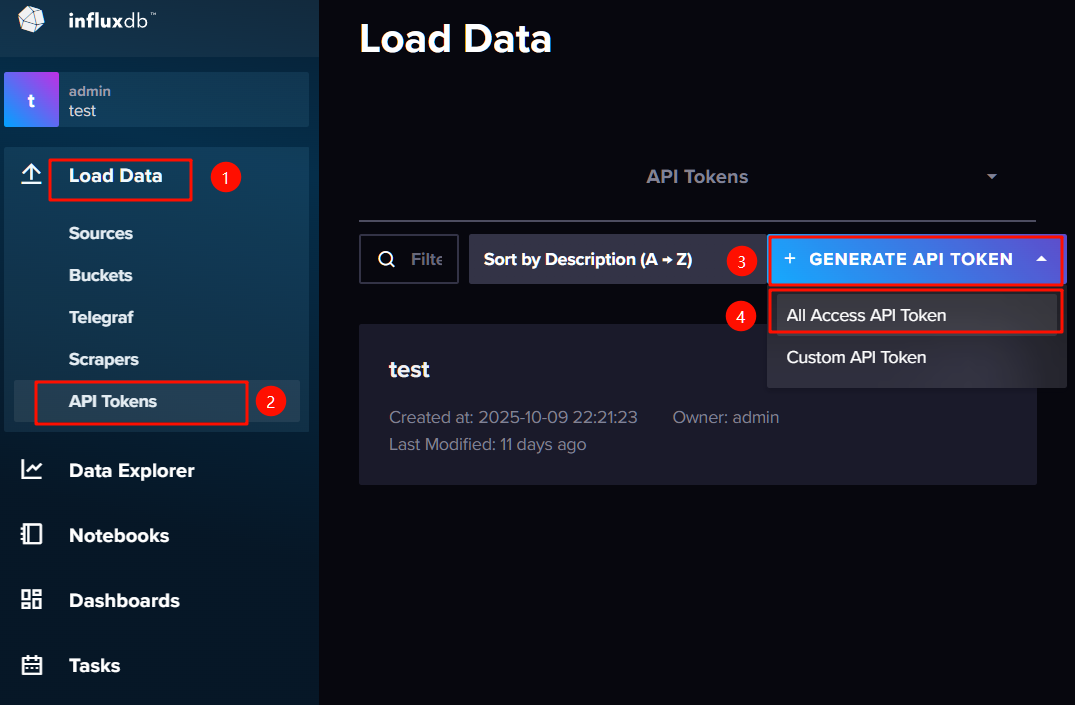
(2)Token填写在InfluxDB后台创建的API token,创建方法如下图
点击最下方的Save & test按钮,如果出现datasource is working. 的提示字样,表示数据源创建完成

导入已配置好的仪表盘
我这里已经配置了一份仪表盘的模板,你可以导入使用。
点击Grafana管理页面的右上角 '+' 号,选择 Import Dashboard

在新打开的页面,Import via dashboard JSON model下的文本框中,粘贴以下代码
点击查看配置代码
{
"annotations": {
"list": [
{
"builtIn": 1,
"datasource": {
"type": "datasource",
"uid": "grafana"
},
"enable": true,
"hide": true,
"iconColor": "rgba(0, 211, 255, 1)",
"name": "Annotations & Alerts",
"target": {
"limit": 100,
"matchAny": false,
"tags": [],
"type": "dashboard"
},
"type": "dashboard"
}
]
},
"editable": true,
"fiscalYearStartMonth": 0,
"graphTooltip": 0,
"id": 1,
"links": [],
"panels": [
{
"datasource": {
"type": "influxdb",
"uid": "ff07iffjvcr9cd"
},
"fieldConfig": {
"defaults": {
"color": {
"mode": "thresholds"
},
"decimals": 2,
"mappings": [],
"max": 35,
"min": -15,
"thresholds": {
"mode": "absolute",
"steps": [
{
"color": "dark-blue",
"value": 0
},
{
"color": "semi-dark-blue",
"value": -15
},
{
"color": "light-blue",
"value": -5
},
{
"color": "super-light-blue",
"value": 5
},
{
"color": "super-light-orange",
"value": 15
},
{
"color": "#EF843C",
"value": 25
},
{
"color": "dark-orange",
"value": 35
}
]
},
"unit": "celsius"
},
"overrides": []
},
"gridPos": {
"h": 8,
"w": 6,
"x": 0,
"y": 0
},
"id": 12,
"options": {
"minVizHeight": 75,
"minVizWidth": 75,
"orientation": "auto",
"reduceOptions": {
"calcs": [
"lastNotNull"
],
"fields": "",
"values": false
},
"showThresholdLabels": false,
"showThresholdMarkers": true,
"sizing": "auto"
},
"pluginVersion": "12.2.0",
"targets": [
{
"datasource": {
"type": "influxdb",
"uid": "AGgeDmvSz"
},
"query": "from(bucket: \"iot_env_monitor\")\r\n |> range(start: v.timeRangeStart, stop: v.timeRangeStop)\r\n |> filter(fn: (r) => r[\"_measurement\"] == \"measurement\")\r\n |> filter(fn: (r) => r[\"_field\"] == \"temp\")\r\n |> aggregateWindow(every: v.windowPeriod, fn: last, createEmpty: false)\r\n |> yield(name: \"last\")",
"refId": "A"
}
],
"title": "当前气温",
"type": "gauge"
},
{
"datasource": {
"type": "influxdb",
"uid": "ff07iffjvcr9cd"
},
"fieldConfig": {
"defaults": {
"color": {
"mode": "thresholds"
},
"decimals": 2,
"mappings": [],
"max": 100,
"min": 0,
"thresholds": {
"mode": "absolute",
"steps": [
{
"color": "dark-orange",
"value": 0
},
{
"color": "light-orange",
"value": 20
},
{
"color": "super-light-orange",
"value": 40
},
{
"color": "light-blue",
"value": 60
},
{
"color": "semi-dark-blue",
"value": 80
},
{
"color": "dark-blue",
"value": 100
}
]
},
"unit": "humidity"
},
"overrides": []
},
"gridPos": {
"h": 8,
"w": 6,
"x": 6,
"y": 0
},
"id": 10,
"options": {
"minVizHeight": 75,
"minVizWidth": 75,
"orientation": "auto",
"reduceOptions": {
"calcs": [
"lastNotNull"
],
"fields": "",
"values": false
},
"showThresholdLabels": false,
"showThresholdMarkers": true,
"sizing": "auto"
},
"pluginVersion": "12.2.0",
"targets": [
{
"datasource": {
"type": "influxdb",
"uid": "AGgeDmvSz"
},
"query": "from(bucket: \"iot_env_monitor\")\r\n |> range(start: v.timeRangeStart, stop: v.timeRangeStop)\r\n |> filter(fn: (r) => r[\"_measurement\"] == \"measurement\")\r\n |> filter(fn: (r) => r[\"_field\"] == \"humid\")\r\n |> aggregateWindow(every: v.windowPeriod, fn: last, createEmpty: false)\r\n |> yield(name: \"last\")",
"refId": "A"
}
],
"title": "当前湿度",
"type": "gauge"
},
{
"datasource": {
"type": "influxdb",
"uid": "ff07iffjvcr9cd"
},
"fieldConfig": {
"defaults": {
"color": {
"mode": "continuous-GrYlRd"
},
"decimals": 0,
"mappings": [],
"max": 5000,
"min": 0,
"thresholds": {
"mode": "absolute",
"steps": [
{
"color": "green",
"value": 0
},
{
"color": "green",
"value": 500
},
{
"color": "yellow",
"value": 1000
},
{
"color": "orange",
"value": 2000
},
{
"color": "red",
"value": 3000
},
{
"color": "purple",
"value": 5000
}
]
},
"unit": "ppm"
},
"overrides": []
},
"gridPos": {
"h": 8,
"w": 6,
"x": 12,
"y": 0
},
"id": 15,
"options": {
"minVizHeight": 75,
"minVizWidth": 75,
"orientation": "auto",
"reduceOptions": {
"calcs": [
"lastNotNull"
],
"fields": "",
"values": false
},
"showThresholdLabels": false,
"showThresholdMarkers": true,
"sizing": "auto"
},
"pluginVersion": "12.2.0",
"targets": [
{
"datasource": {
"type": "influxdb",
"uid": "AGgeDmvSz"
},
"query": "from(bucket: \"iot_env_monitor\")\r\n |> range(start: v.timeRangeStart, stop: v.timeRangeStop)\r\n |> filter(fn: (r) => r[\"_measurement\"] == \"measurement\")\r\n |> filter(fn: (r) => r[\"_field\"] == \"co2\")\r\n |> aggregateWindow(every: v.windowPeriod, fn: last, createEmpty: false)\r\n |> yield(name: \"last\")",
"refId": "A"
}
],
"title": "CO2",
"type": "gauge"
},
{
"datasource": {
"type": "influxdb",
"uid": "ff07iffjvcr9cd"
},
"fieldConfig": {
"defaults": {
"color": {
"mode": "continuous-GrYlRd"
},
"decimals": 0,
"mappings": [],
"max": 500,
"min": 0,
"thresholds": {
"mode": "absolute",
"steps": [
{
"color": "green",
"value": 0
},
{
"color": "red",
"value": 80
}
]
}
},
"overrides": []
},
"gridPos": {
"h": 8,
"w": 6,
"x": 18,
"y": 0
},
"id": 14,
"options": {
"minVizHeight": 75,
"minVizWidth": 75,
"orientation": "auto",
"reduceOptions": {
"calcs": [
"lastNotNull"
],
"fields": "",
"values": false
},
"showThresholdLabels": false,
"showThresholdMarkers": true,
"sizing": "auto"
},
"pluginVersion": "12.2.0",
"targets": [
{
"datasource": {
"type": "influxdb",
"uid": "AGgeDmvSz"
},
"query": "from(bucket: \"iot_env_monitor\")\r\n |> range(start: v.timeRangeStart, stop: v.timeRangeStop)\r\n |> filter(fn: (r) => r[\"_measurement\"] == \"measurement\")\r\n |> filter(fn: (r) => r[\"_field\"] == \"voc\")\r\n |> aggregateWindow(every: v.windowPeriod, fn: last, createEmpty: false)\r\n |> yield(name: \"last\")",
"refId": "A"
}
],
"title": "VOC",
"type": "gauge"
},
{
"datasource": {
"type": "influxdb",
"uid": "ff07iffjvcr9cd"
},
"fieldConfig": {
"defaults": {
"color": {
"mode": "continuous-YlBl"
},
"custom": {
"axisBorderShow": false,
"axisCenteredZero": false,
"axisColorMode": "text",
"axisLabel": "",
"axisPlacement": "auto",
"barAlignment": 0,
"barWidthFactor": 0.6,
"drawStyle": "line",
"fillOpacity": 0,
"gradientMode": "none",
"hideFrom": {
"legend": false,
"tooltip": false,
"viz": false
},
"insertNulls": false,
"lineInterpolation": "smooth",
"lineStyle": {
"fill": "solid"
},
"lineWidth": 2,
"pointSize": 5,
"scaleDistribution": {
"type": "linear"
},
"showPoints": "auto",
"showValues": false,
"spanNulls": false,
"stacking": {
"group": "A",
"mode": "none"
},
"thresholdsStyle": {
"mode": "off"
}
},
"mappings": [],
"thresholds": {
"mode": "absolute",
"steps": [
{
"color": "green",
"value": 0
},
{
"color": "red",
"value": 80
}
]
},
"unit": "celsius"
},
"overrides": []
},
"gridPos": {
"h": 11,
"w": 6,
"x": 0,
"y": 8
},
"id": 8,
"options": {
"legend": {
"calcs": [
"lastNotNull",
"min",
"max"
],
"displayMode": "table",
"placement": "bottom",
"showLegend": true
},
"tooltip": {
"hideZeros": false,
"maxHeight": 600,
"mode": "single",
"sort": "none"
}
},
"pluginVersion": "12.2.0",
"targets": [
{
"datasource": {
"type": "influxdb",
"uid": "AGgeDmvSz"
},
"query": "from(bucket: \"iot_env_monitor\")\r\n |> range(start: v.timeRangeStart, stop: v.timeRangeStop)\r\n |> filter(fn: (r) => r[\"_measurement\"] == \"measurement\")\r\n |> filter(fn: (r) => r[\"_field\"] == \"temp\")\r\n |> aggregateWindow(every: v.windowPeriod, fn: mean, createEmpty: false)\r\n |> yield(name: \"mean\")",
"refId": "A"
}
],
"title": "温度趋势图",
"type": "timeseries"
},
{
"datasource": {
"type": "influxdb",
"uid": "ff07iffjvcr9cd"
},
"fieldConfig": {
"defaults": {
"color": {
"mode": "continuous-GrYlRd"
},
"custom": {
"axisBorderShow": false,
"axisCenteredZero": false,
"axisColorMode": "text",
"axisLabel": "",
"axisPlacement": "auto",
"barAlignment": 0,
"barWidthFactor": 0.6,
"drawStyle": "line",
"fillOpacity": 0,
"gradientMode": "none",
"hideFrom": {
"legend": false,
"tooltip": false,
"viz": false
},
"insertNulls": false,
"lineInterpolation": "smooth",
"lineWidth": 2,
"pointSize": 5,
"scaleDistribution": {
"type": "linear"
},
"showPoints": "auto",
"showValues": false,
"spanNulls": false,
"stacking": {
"group": "A",
"mode": "none"
},
"thresholdsStyle": {
"mode": "off"
}
},
"mappings": [],
"thresholds": {
"mode": "absolute",
"steps": [
{
"color": "green",
"value": 0
},
{
"color": "red",
"value": 80
}
]
},
"unit": "humidity"
},
"overrides": []
},
"gridPos": {
"h": 11,
"w": 6,
"x": 6,
"y": 8
},
"id": 2,
"options": {
"legend": {
"calcs": [
"last",
"min",
"max"
],
"displayMode": "table",
"placement": "bottom",
"showLegend": true
},
"tooltip": {
"hideZeros": false,
"maxHeight": 600,
"mode": "single",
"sort": "none"
}
},
"pluginVersion": "12.2.0",
"targets": [
{
"datasource": {
"type": "influxdb",
"uid": "AGgeDmvSz"
},
"query": "from(bucket: \"iot_env_monitor\")\r\n |> range(start: v.timeRangeStart, stop: v.timeRangeStop)\r\n |> filter(fn: (r) => r[\"_measurement\"] == \"measurement\")\r\n |> filter(fn: (r) => r[\"_field\"] == \"humid\")\r\n |> aggregateWindow(every: v.windowPeriod, fn: mean, createEmpty: false)\r\n |> yield(name: \"mean\")",
"refId": "A"
}
],
"title": "湿度趋势图",
"type": "timeseries"
},
{
"datasource": {
"type": "influxdb",
"uid": "ff07iffjvcr9cd"
},
"fieldConfig": {
"defaults": {
"color": {
"mode": "continuous-BlPu"
},
"custom": {
"axisBorderShow": false,
"axisCenteredZero": false,
"axisColorMode": "text",
"axisLabel": "",
"axisPlacement": "auto",
"barAlignment": 0,
"barWidthFactor": 0.6,
"drawStyle": "line",
"fillOpacity": 0,
"gradientMode": "none",
"hideFrom": {
"legend": false,
"tooltip": false,
"viz": false
},
"insertNulls": false,
"lineInterpolation": "smooth",
"lineStyle": {
"fill": "solid"
},
"lineWidth": 2,
"pointSize": 2,
"scaleDistribution": {
"type": "linear"
},
"showPoints": "auto",
"showValues": false,
"spanNulls": false,
"stacking": {
"group": "A",
"mode": "none"
},
"thresholdsStyle": {
"mode": "off"
}
},
"decimals": 0,
"mappings": [],
"thresholds": {
"mode": "absolute",
"steps": [
{
"color": "orange",
"value": 0
},
{
"color": "red",
"value": 80
}
]
},
"unit": "ppm"
},
"overrides": []
},
"gridPos": {
"h": 11,
"w": 6,
"x": 12,
"y": 8
},
"id": 6,
"options": {
"legend": {
"calcs": [
"last",
"min",
"max"
],
"displayMode": "table",
"placement": "bottom",
"showLegend": true
},
"tooltip": {
"hideZeros": false,
"maxHeight": 600,
"mode": "single",
"sort": "none"
}
},
"pluginVersion": "12.2.0",
"targets": [
{
"datasource": {
"type": "influxdb",
"uid": "AGgeDmvSz"
},
"query": "from(bucket: \"iot_env_monitor\")\r\n |> range(start: v.timeRangeStart, stop: v.timeRangeStop)\r\n |> filter(fn: (r) => r[\"_measurement\"] == \"measurement\")\r\n |> filter(fn: (r) => r[\"_field\"] == \"co2\")\r\n |> aggregateWindow(every: v.windowPeriod, fn: mean, createEmpty: false)\r\n |> yield(name: \"mean\")",
"refId": "A"
}
],
"title": "CO2趋势图",
"type": "timeseries"
},
{
"datasource": {
"type": "influxdb",
"uid": "ff07iffjvcr9cd"
},
"fieldConfig": {
"defaults": {
"color": {
"mode": "continuous-BlPu"
},
"custom": {
"axisBorderShow": false,
"axisCenteredZero": false,
"axisColorMode": "text",
"axisLabel": "",
"axisPlacement": "auto",
"barAlignment": 0,
"barWidthFactor": 0.6,
"drawStyle": "line",
"fillOpacity": 0,
"gradientMode": "none",
"hideFrom": {
"legend": false,
"tooltip": false,
"viz": false
},
"insertNulls": false,
"lineInterpolation": "smooth",
"lineStyle": {
"fill": "solid"
},
"lineWidth": 2,
"pointSize": 2,
"scaleDistribution": {
"type": "linear"
},
"showPoints": "auto",
"showValues": false,
"spanNulls": false,
"stacking": {
"group": "A",
"mode": "none"
},
"thresholdsStyle": {
"mode": "off"
}
},
"decimals": 0,
"mappings": [],
"thresholds": {
"mode": "absolute",
"steps": [
{
"color": "orange",
"value": 0
},
{
"color": "red",
"value": 80
}
]
}
},
"overrides": []
},
"gridPos": {
"h": 11,
"w": 6,
"x": 18,
"y": 8
},
"id": 16,
"options": {
"legend": {
"calcs": [
"last",
"min",
"max"
],
"displayMode": "table",
"placement": "bottom",
"showLegend": true
},
"tooltip": {
"hideZeros": false,
"maxHeight": 600,
"mode": "single",
"sort": "none"
}
},
"pluginVersion": "12.2.0",
"targets": [
{
"datasource": {
"type": "influxdb",
"uid": "AGgeDmvSz"
},
"query": "from(bucket: \"iot_env_monitor\")\r\n |> range(start: v.timeRangeStart, stop: v.timeRangeStop)\r\n |> filter(fn: (r) => r[\"_measurement\"] == \"measurement\")\r\n |> filter(fn: (r) => r[\"_field\"] == \"voc\")\r\n |> aggregateWindow(every: v.windowPeriod, fn: mean, createEmpty: false)\r\n |> yield(name: \"mean\")",
"refId": "A"
}
],
"title": "VOC趋势图",
"type": "timeseries"
}
],
"preload": false,
"refresh": "1m",
"schemaVersion": 42,
"tags": [],
"templating": {
"list": []
},
"time": {
"from": "now-6h",
"to": "now"
},
"timepicker": {},
"timezone": "",
"title": "IoT_Environment_Monitoring",
"uid": "ehJhdiDIz",
"version": 14
}将上述代码粘贴到文本框中,点击 Load 加载,下一个页面点击 Import 导入,
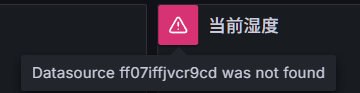
修改仪表盘的数据源
由于数据源的uid不同,会出现 Database xxx not found 的报错,你需要手动修改。
点击某个面板上的省略号,点击Edit 
点击 Queries ,在datasource处点击,选择influxdb,最后点击右上角的save dashboard

这里对其他几个数据面板也进行同样操作,不再重复讲解展示。
最终效果
为了验证数据上云这一章节的成果,请按以下步骤操作:
(1)使用命令sudo docker start emqx启动EMQX MQTT服务器
(2)确保InfluxDB和Grafana正常运行(跟随本小节配置的话,肯定是正常运行的)
(3)启动MQTT数据存储程序
(4)将桌面环境监测仪开机、连接WIFI、连接MQTT
(5)在Grafana数据大屏查看数据
